Energy metering and monitoring allows companies, however small, to reduce your carbon emissions systematically through measures tailored to your company.
“You cannot manage what you don’t measure and what is not measured is not managed.”
Introduction
Energy metering and monitoring gives you a better understanding of your company’s energy consumption. This understanding allows you to manage and predict energy costs more accurately, and also provides the opportunity to identify and tackle energy waste. To reduce energy use effectively, your company needs to: identify the factors that impact energy use; implement measures to tackle energy waste; and put targets in place to assess progress.
Monitoring and reporting is a continuous process, and once established it should be easy and quick to manage.

Carbon Trust Energy Management Guide
There are many ways of tracking your energy use depending on the level of metering access in your office. Examples include reviewing your energy bill data, taking manual meter readings from your meter or sub-meters, requesting half hourly automatic meter reading from your energy supplier, or installing a sub-metering system with automatic monitoring & targeting (aM&T).
Effective metering and monitoring is a key part of energy management, and it can help companies to:
- Detect energy waste, and reduce this to cut costs
- Quantify the energy savings that you achieve over time
- Support investment projects with reliable data
- Inspire behaviour change, by creating an energy awareness scheme and tracking
the impact
- Benchmark energy consumption and track improvements
- Identify maintenance issues that would not otherwise have been noticed
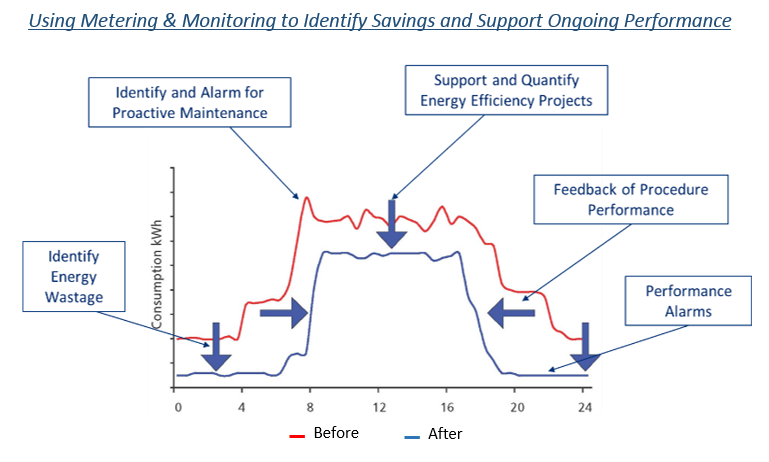
An example of how the use of half hourly data can be used to achieve energy savings.

You can achieve significant energy savings just by understanding your data. The red line on the graph shows the energy use over a typical day before any energy monitoring. The blue arrows highlight areas where energy savings may be achieved. The blue line demonstrates improved performance to be monitored and reported.
Recommendations
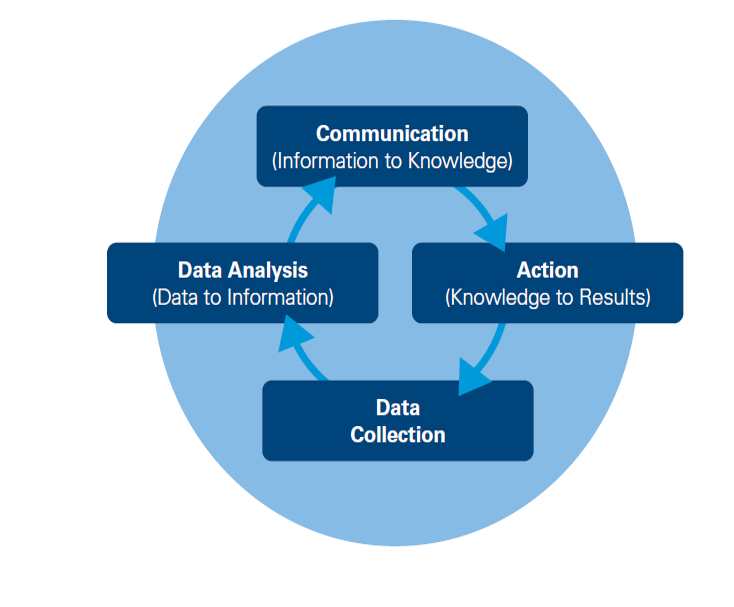
It is important to be systematic about your approach to measuring and reducing energy consumption. To manage energy successfully you need to measure how much you use and understand the reasons why. Then you need to consider how to report this information in the best way to help you make savings. Use our simplified process below:
- Initial review: Identify the sources of energy data that are available to you.
- Data collection: Collect the data from the identified sources in a standardised way.
- Monitoring: Put a strategy in place for how frequently the data is collected, analysed and reviewed.
- Reporting: Analyse the data that you have collected, identifying particular areas of interest and unexpected peaks. Integrate regular reporting into your energy management practices.
- Targeting: Use your data analysis to set performance targets, benchmark your energy consumption and identify energy waste.
- Review and improve: Frequently refresh your analysis, review your benchmark, revise your targets, and use the greater understanding that the data gives you to support wider energy management.
Find out more about how to implement the steps above by reading the advice in the next section.
Additional Information
1. Initial Review
The first step of any metering and monitoring process is to find out what data is available. You may have access to more than you think – often energy suppliers collect half-hourly meter readings without the occupants realising it, and in many large, modern buildings, sub-metering is required by building regulations. Data sources include utility bills, onsite mains or energy meters, or even data collected by others - such as the metering & monitoring undertaken by building facilities management (FM) companies. If you are unsure of what type of metering data is available to you, ask your landlord, FM contractor or energy supplier.
2. Data collection
The different types of metering options typically found in offices are explained below, from the lowest tech options, to the most sophisticated, automated systems.
Review your energy bill data: Energy bills provide the total amount of energy used, day & night consumption, and tariff cost information. Care should be taken with energy bill data when ‘estimated’ energy data is used by your suppliers. If you have a half hourly supply, further information such as your peak power demand and charges may also be available. Energy consumption and cost data should be collated from your bills into a spreadsheet.
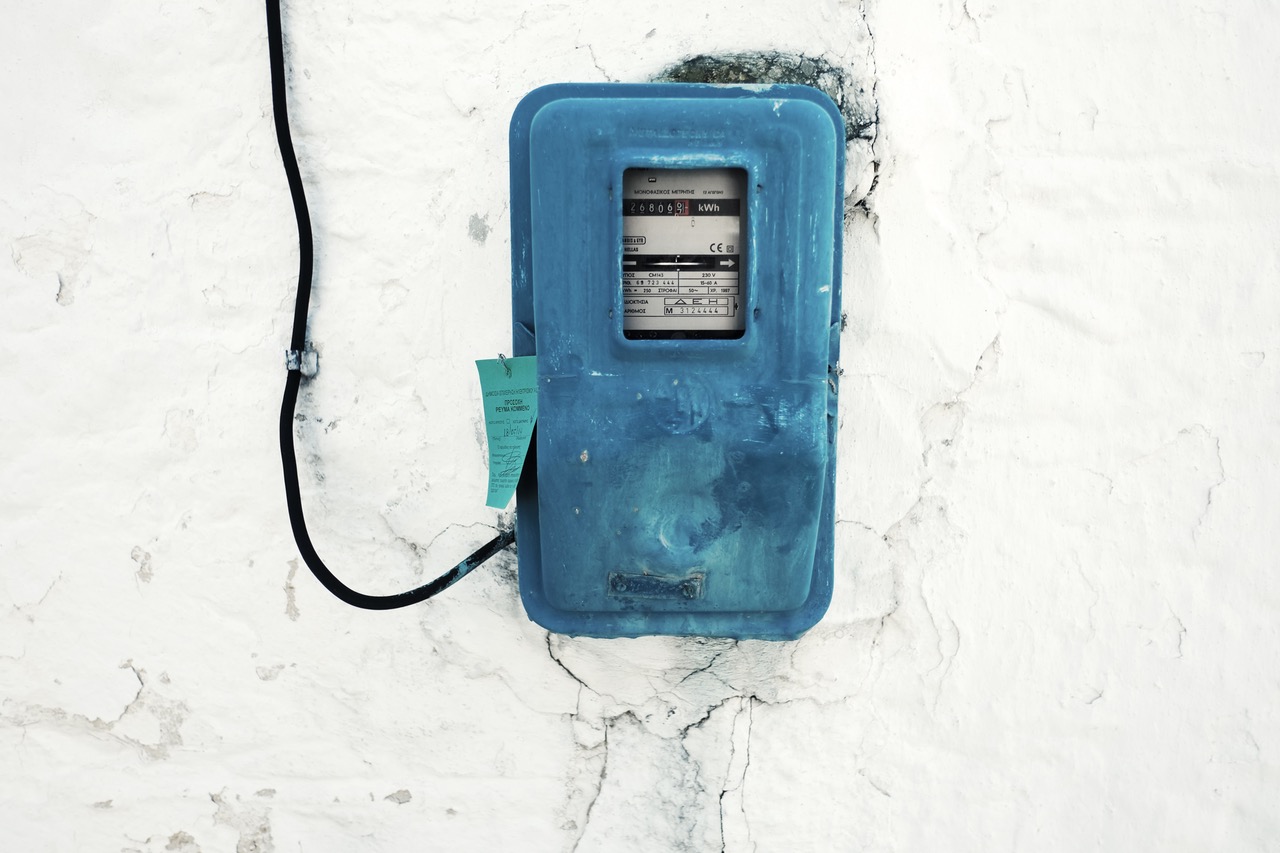
Take regular manual meter readings: If you do not have access to automatic meter readings, then taking regular manual reading of your mains and sub-meters is the simplest option to collect the data. Manual readings can be taken by hand from your energy meter, and then recoded in a spreadsheet or energy monitoring system. Care should be taken when recording manual reads, often it is easy to record the wrong number of decimals, and sometimes advanced meters need to be cycled through to show day, night and total consumption. Manual readings should be taken regularly, often weekly or monthly, and can be used to assess performance and compare with billing data.
Manual readings can be used for bespoke data analysis, for instance an evening and morning reading can be taken to assess out of hours energy use. Most sub-meters also show instantaneous power; reviewing this data can show the effect of turning equipment off or upgrading to energy efficient equipment. To support data collection by manual reads, download the data collection template for collecting this type of data.
Use half-hourly automatic meter readings: Depending on the scale and profile of energy use, you may be supplied by a half-hourly energy supply. Additionally, as part of the smart meter rollout, it is likely that you will be upgraded to a half-hourly supply meter in the future. Energy suppliers often collect half-hourly meter readings in order to accurately record the energy use and bill the customer for the exact amount of energy used. You can see if you are on a half-hourly meter by assessing your energy bills. If so, your suppliers can make this data available to you, often via an online portal. Get in touch with your energy supplier if you have a half-hourly meter and request access to your data.
The rollout of smart meters to many businesses in the UK is making metered data more accessible. Contact Smart Energy GB to find out how to get a smart meter installed in your business.
What is “half hourly” data?
“Half hourly” data refers to automatic metering systems which regularly send data to a central monitoring system (either the energy supplier or a third party meter reading or FM company, or an internal monitoring and targeting system). The data may be sent every half hour or more frequently.
Software is then used to determine the energy consumption in each half hour. This can be plotted over time to allow users to see a profile of energy use during the day. It makes it easier to spot wasted energy used at night or weekends, unexpected peaks in energy demand, or an overall high level of energy use.
By comparing profiles from day to day, week to week etc., variations can be identified - and also energy reductions resulting from improvements can be observed.
“Employ a sub-metering system with automatic monitoring & targeting (aM&T): The use of sub-metering and aM&T is now required by building regulations for buildings over a certain size, so new or recently refurbished buildings are therefore likely to have sub-meters . If your offices are located in such a building, it may be possible that you have access to an advanced aM&T system - you can check this with your facilities management or building management. AM&T systems are designed to measure energy consumption, store data, and provide a platform for analyse and reporting. More sophisticated systems can offer email data report distribution, and high consumption alarms too. If you have access to an aM&T system, dedicate time to understanding how it works and put in place a review and reporting mechanism to get the most of the data available to you.
3. Monitoring and Analysis
This is a key step so you need to put in place a strategy for how frequently the data is collected, analysed and reviewed. Individual employees should be given specific responsibility for the data collection and the data analysis.
The frequency of your data collection depends on how much energy you use (the more you use the more frequently you should collect data) and the type of data collection available to you (automatic systems will take readings regularly, while it may not be practical to take manual meter readings as often).
You should also set up a schedule for the frequency of data analysis and review. This depends on the level of information that you are aiming to glean from the process – if you think that energy is being wasted, it may be useful to undertake analysis as frequently as weekly, but if you are introducing a metering and monitoring process simply to have a better awareness or report on your energy use, a brief review once a month may be sufficient.
A good way of using the collected data is to set targets for energy use and energy reduction, and monitor progress against those targets on a monthly, quarterly and yearly basis.
4. Reporting
The collection of data will not in itself save energy – it is the insights you gain and the subsequent actions you take that will help make savings for your business.
Highlighting maintenance issues and unexpected peaks, which are signs of wasted energy
One of the key functions of a monitoring and targeting scheme is to draw attention to sudden instances of high energy consumption. If a meter reading suddenly increases even though your company has not changed its activities, it could be highlighting a problem, such as that the heating has been left on overnight by mistake or a hot water tap is leaking.
At a simple level, plotting energy use over time, and marking on any relevant changes (e.g. temperature changes, changes in occupancy etc.) will allow you to identify unusual occurrences and unexpected consumption. It is important to identify all the ‘driving factors’ behind energy consumption before jumping to conclusions.
If you identify high unexpected energy use or high out of hours consumption, draw up a list of actions to combat these, such as automatically powering down computers at the end of each day, or changing the timer settings on your heating system.
Reducing out of hours energy use: Offices have an energy ‘base load’, which is the energy that is consumed even when the building is not being used. This may be from appliances that need to be kept on all the time, such as fridges, chilled food vending machines, wireless routers, IT server rooms and hot water tanks. Other factors often contribute to the baseload unnecessarily, such as computers that aren’t powered down, lights left on and heating or cooling systems that haven’t been turned off.
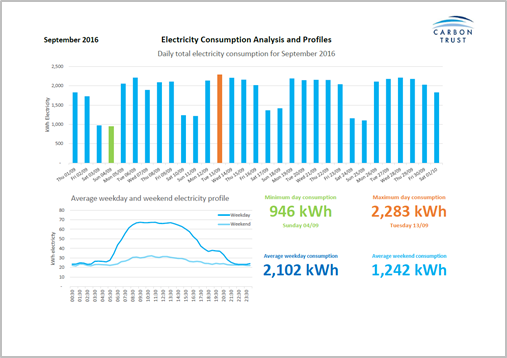
You can see your baseload by plotting your daily energy consumption on a bar chart, like the one below. This shows how much energy is being used when no one is in the office, such as at weekends or national holidays. You can use this data to try to reduce energy wastage, and track your progress as the base load decreases.

Electricity consumption analysis, showing out of hours electricity use at weekends compared to electricity use during the working week. The line chart shows the half hourly electricity use for two 24 hour periods – one during the week and one at the weekend.
5. Targeting
In order to systematically reduce your energy consumption, it helps to set targets to work towards and benchmarks to improve upon.
Setting targets: Targets should be stretching enough to motivate employees but not so ambitious that they expect to fail. Engage employees by communicating this target to them, and describing changes that they can make to contribute. People are more likely to change their habits if they understand how their actions affect consumption, and if they know that their efforts are being monitored! See the Involve your staff page for more tips on how to do this.
Benchmarking: Benchmarking allows companies to compare their performance against best practice. That can mean comparison with similar organisations if data is available. But it can be as simple as comparing energy use each week or month with the average, or best achieved so far within your own company. Benchmarking is important because it enables you to see the potential to bring energy use to the lowest realistic level.
Improving data quality To further improve the quality of this data, you can collect ‘driving factor’ data i.e. data on the variables that affect energy consumption. These could be things as simple as average daily outside temperatures or daily office occupancy. Both usually have an effect on the amount of energy businesses consume. For example energy use might be higher than expected on an especially cold day in winter, and it might be lower on a day when the majority of staff are out of the office, so are not using their computers and kitchen equipment.
You can plot this data against your energy consumption to provide reasoning for unexplainable peaks and troughs of energy use. To examine the effect of outside temperature, you can look up the ‘degree days’ for your region, and plot these temperatures against your energy data. Similarly, you can count the number of employees in the office every day, and plot the occupancy numbers against your energy consumption.
6. Review and improve
Metering and monitoring can evolve over time from a simple, manual process, to a full aM&T system.
Assess the effectiveness: Regularly assess the effectiveness of your metering and monitoring process, to see if it is delivering on what you hoped to achieve. This assessment may highlight successes and indicate areas that are not making a significant difference. Share the successful aspects with staff members to motivate them to keep up their efforts and to show that their involvement in energy reduction is appreciated. Schedule small reviews throughout the year, and plan a detailed assessment annually.
Continuously improve and evolve: Use the knowledge of these successes and failures to continuously improve your metering and monitoring process. Reset targets as each one is achieved, update your benchmark and refresh your staff engagement campaigns to focus on new projects and actions. If you started by taking manual readings, investigate the potential for fitting a meter that can provide you with more granular data. As your data improves, you will be able to identify more opportunities for energy reduction.
Embed into energy management: As your business grows, consider expanding your metering and monitoring process into a full energy management programme. Use your process as a basis for energy reduction across all areas of your operations. Successful energy management includes:
- Commitment from senior management
- A company energy policy
- A company energy strategy, involving metering and monitoring, procurement,
investment, regulatory compliance, opportunity identification, staff engagement and communication
If your business meets certain sustainability criteria you can have your energy management system certified to a recognised standard. Certification is a way of demonstrating and communicating your energy management commitments and achievements to the general public. It is increasingly being required or sought after by larger companies seeking to reduce emissions in their supply chains. Consequently, becoming more energy efficient could help you stand out from the competition.
How often should I take meter readings?
This depends on how much detail you need: monthly readings require less time but provide fewer insights on how to save energy, whereas half-hourly readings can be a data overload but can pinpoint over consumption much more easily. If you don’t have access to half-hourly data, start with monthly readings and slowly increase the frequency as your need for granular data increases.


